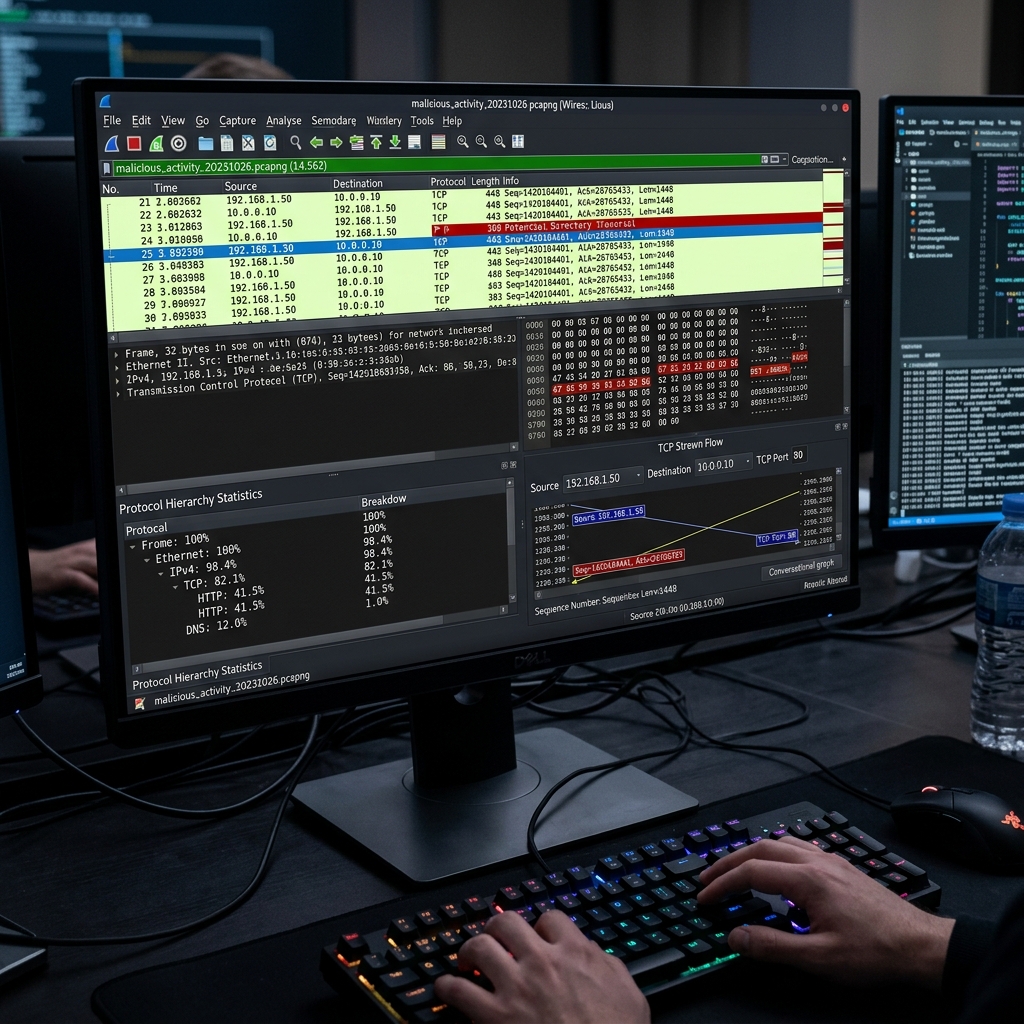
Anyone can open Wireshark and watch packets scroll by. Turning that firehose into a finding is the real skill. A packet capture is ground truth: it cannot be edited by a process that already owns the endpoint, which is exactly why network evidence is so valuable during an investigation. Here is how I hunt through a PCAP instead of just staring at one.
Capture Filters and Display Filters Are Not the Same
This trips up everyone at first. Capture filters use BPF syntax and decide what gets recorded. Display filters use Wireshark syntax and decide what you see from an existing capture. You record broadly and filter narrowly:
# Capture filter (BPF), recorded at capture time
host 10.10.10.50 and not port 22

# Display filter (Wireshark), applied while analyzing
http.request.method == "POST" && ip.dst == 10.10.10.50
Get comfortable with display filters, because hunting is mostly about slicing the same capture a dozen different ways.
Start with the Big Picture
Before drilling into packets, use the Statistics menu. Statistics > Conversations ranks every talker pair by bytes and packets. Two questions surface fast: who is talking the most, and who is talking to somewhere they should not. A workstation holding a long, steady conversation with an unfamiliar external IP is worth a closer look. Statistics > Protocol Hierarchy then shows the protocol mix, where an odd amount of DNS or ICMP can betray tunneling.
Hunting Command and Control Beacons
Malware that calls home tends to beacon: small, regular connections to a controller. Humans browse in bursts; beacons are metronomic. Filter to a suspicious destination and watch the timing:
ip.dst == 185.0.0.5 && tcp.flags.syn == 1If new connections appear at a near constant interval, for example every sixty seconds give or take a little jitter, that regularity is a classic beaconing signature. Real user traffic almost never looks that evenly spaced.
Following the Conversation
Right click any packet and choose Follow > TCP Stream to reassemble a whole exchange into readable text. This is how you read an HTTP request and response, or spot credentials sent in the clear. For HTTP specifically, filtering to requests reveals the story of what was fetched and posted:
http.requestLook for suspicious user agent strings, requests to raw IP addresses instead of domains, and POSTs of unexpected size, which can indicate data leaving the building.
Spotting DNS Tunneling
DNS is allowed out of almost every network, which makes it a favorite covert channel. Tunneling stuffs data into long, high entropy subdomain labels and abuses record types like TXT. Hunt for it with:
dns.qry.name.len > 50 || dns.qry.type == 16A flood of long, random looking lookups to a single domain is not normal name resolution. It is very often exfiltration or a tunneled channel.
Extracting Transferred Files
When you suspect a payload crossed the wire, Wireshark can carve it out. File > Export Objects > HTTP lists every object transferred over HTTP and lets you save them for hashing and sandbox analysis. Pulling the actual binary out of a capture and confirming its hash against threat intelligence is often the moment an investigation becomes concrete.
Scaling Up with tshark
The graphical interface is perfect for exploration but painful for repetition. Its command line sibling, tshark, is built for automation:
# Top destination IPs by packet count
tshark -r capture.pcap -q -z ip_hosts,tree

# Extract every DNS query name
tshark -r capture.pcap -Y "dns.flags.response == 0" -T fields -e dns.qry.name
When you need to grind through gigabytes of capture or feed results into a script, tshark is the tool.
Key Takeaways
- Capture broadly, then slice with display filters during analysis.
- Start with Conversations and Protocol Hierarchy before reading packets.
- Regular, metronomic connections are a beaconing red flag.
- Long, high entropy DNS names often mean tunneling or exfiltration.
- Carve out transferred files and hash them to make findings concrete.
- Reach for tshark when the work becomes repetitive or large.
Packet analysis feels slow until the patterns click. Once they do, a PCAP stops being noise and starts telling you exactly what happened.
// Discussion